Healthcare-Analytics-Dashboard
Hospital Data Analysis using Power BI
Project Overview
This project focuses on analyzing hospital patient data using Power BI to uncover insights related to patient demographics, treatment costs, and medical outcomes. The dashboard provides an interactive and visual way to understand healthcare trends.
Dataset
- Hospital patient dataset (CSV format)
- Includes information such as:
- Age
- Gender
- Medical condition
- Treatment cost
- Outcome
- Length of stay
Tool Used
- Power BI Desktop
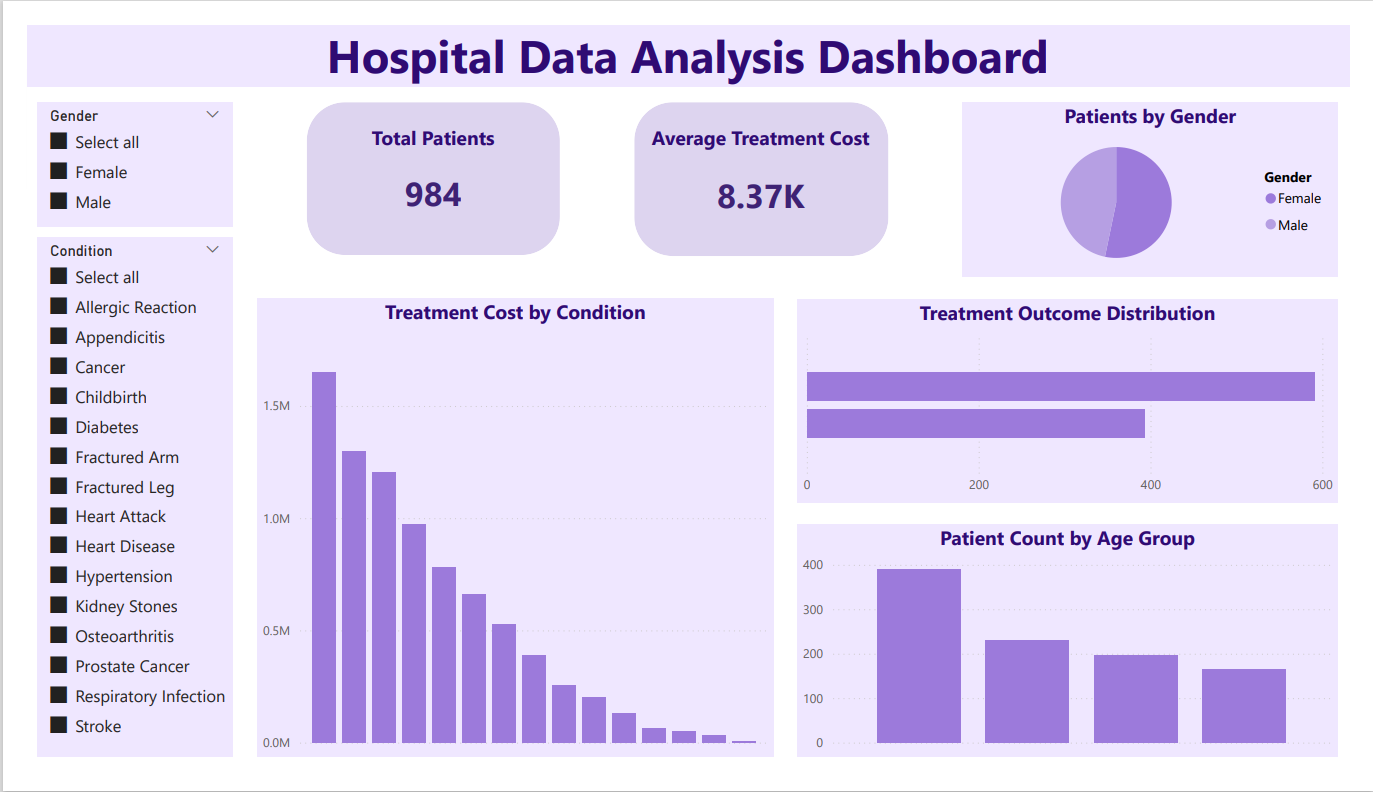
Dashboard Features
- Total Patients KPI
- Average Treatment Cost KPI
- Patients by Gender (Pie Chart)
- Patient Count by Age Group (Grouped Bar Chart)
- Treatment Cost by Condition (Bar Chart)
- Treatment Outcome Distribution (Bar Chart)
- Interactive slicers for Gender and Condition
Key Insights
- Most patients fall within the middle-age groups.
- Treatment costs are highest for chronic and serious conditions.
- Patient outcomes vary significantly based on condition type.
- Gender distribution shows a balanced patient ratio.
Output
- Interactive Power BI dashboard (.pbix)
- Exported dashboard report in PDF format
Dashboard Output