Interactive_Housing_Price_Dashboard
Interactive Housing Price Dashboard (Power BI)
COMPANY: CODTECH IT SOLUTIONS
NAME: S.WINCE
INTERN ID: CTIS5393
DOMAIN: DATA ANALYTICS
DURATION: 4 WEEEKS
MENTOR: NEELA SANTOSH
Overview
This project focuses on building an interactive Power BI dashboard to analyze housing price trends using the House Price India dataset. The dashboard provides clear insights into pricing patterns, house distribution, and construction trends through dynamic visuals and filters.
Objectives
Create an interactive dashboard using Power BI
Analyze house prices based on number of floors
Identify housing trends over time
Enable user-driven filtering for better exploration
Dataset
Source: House Price India dataset
Key Fields Used:
Price
Number of Floors
Built Year
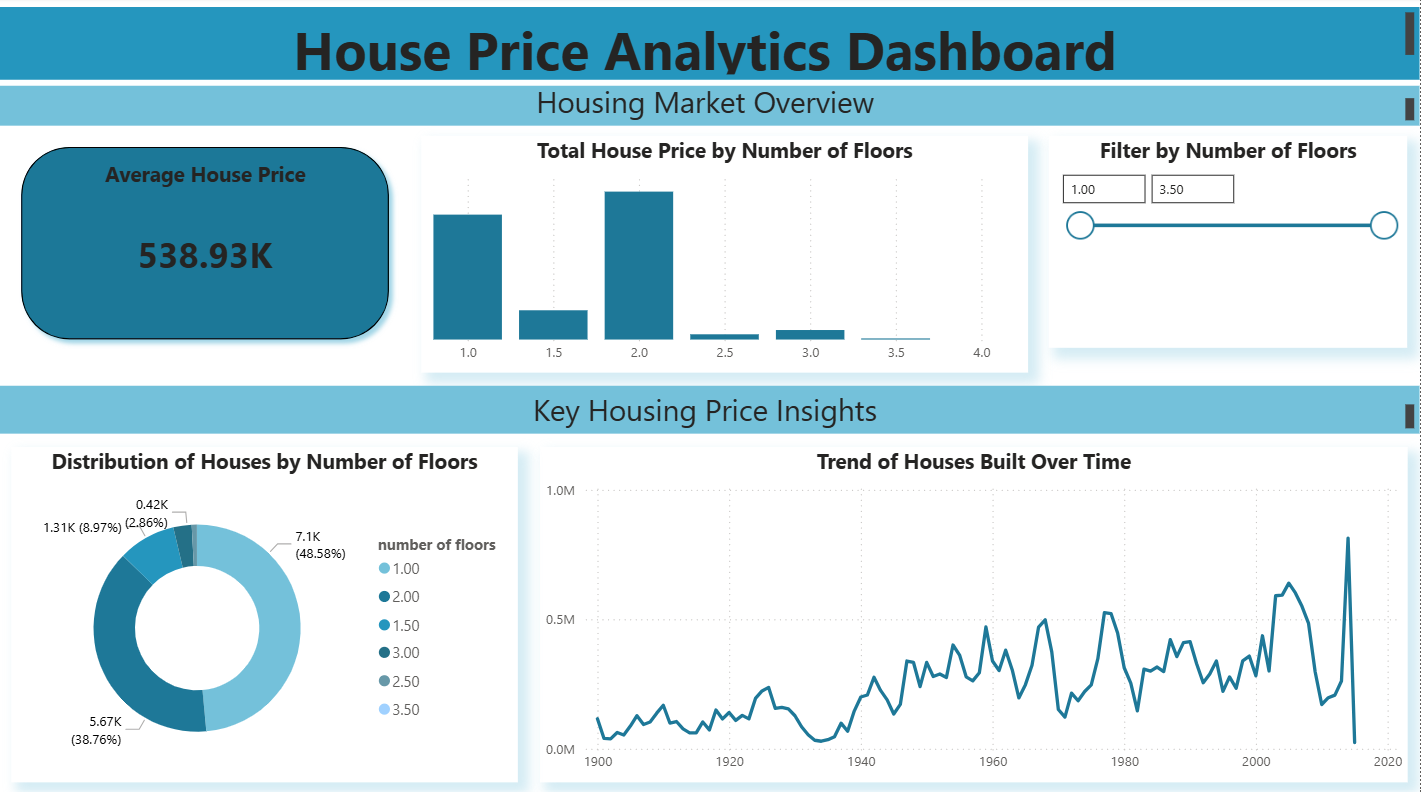
Dashboard Visuals
KPI Card: Average House Price
Column Chart: Total House Price by Number of Floors
Donut Chart: Distribution of Houses by Number of Floors
Line Chart: Trend of Houses Built Over Time
Slicer: Filter by Number of Floors
Key Insights
Houses with 1–2 floors contribute the highest share of total prices
Construction activity shows an upward trend in recent decades
Interactive filters allow quick comparison across different house types
Tools Used
Power BI Desktop
CSV Dataset
Dashboard Preview
Conclusion
This dashboard effectively transforms raw housing data into actionable insights using interactive visuals. It demonstrates practical skills in data visualization, dashboard design, and business analytics.