Sales-trends-regional-insights-dashboard
Sales Trends & Regional Insights Dashboard
Project Overview
This project presents an interactive Power BI dashboard designed to analyze sales trends, regional performance, product categories, and shipping modes using a retail sales dataset.
The dashboard helps business users quickly understand key sales patterns and performance drivers.
Tools Used
- Power BI
- CSV Dataset (Retail Sales)
Dataset
- File:
train.csv - Key Columns:
- Order Date
- Region
- Category
- Product Name
- Sales
- Ship Mode
Dashboard Features
- KPI Cards for Total Sales, Total Orders, and Average Sales per Order
- Monthly Sales Trend analysis
- Regional Sales Performance comparison
- Category-wise Sales Contribution
- Top Products by Sales
- Shipping Mode Sales Distribution
- Interactive Region Filter (Slicer)
Dashboard Preview
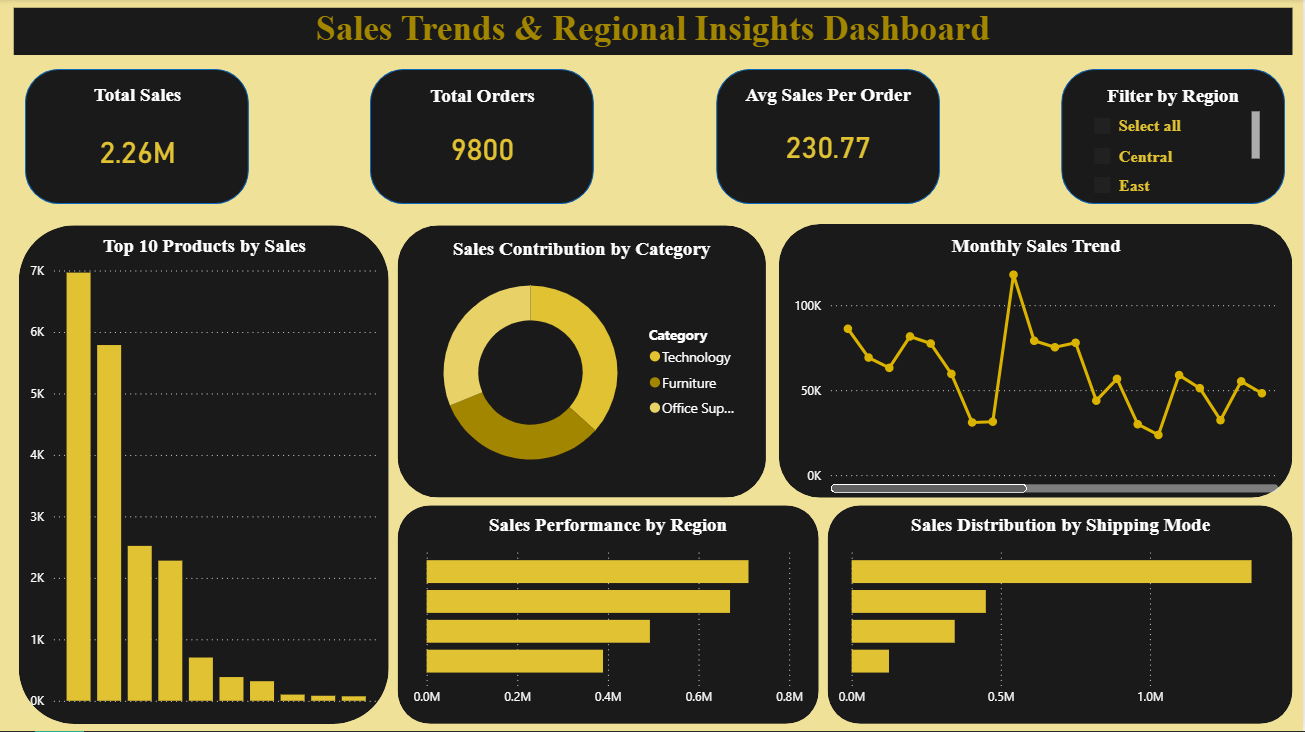
Key Insights
- Sales show noticeable fluctuations across months, indicating seasonal trends.
- The West region contributes the highest overall sales.
- Technology is the top-performing category by revenue.
- Standard Class shipping accounts for the largest share of sales.